| << Previous 1... 11 12 [13] 14 15 ...45 Next >> |

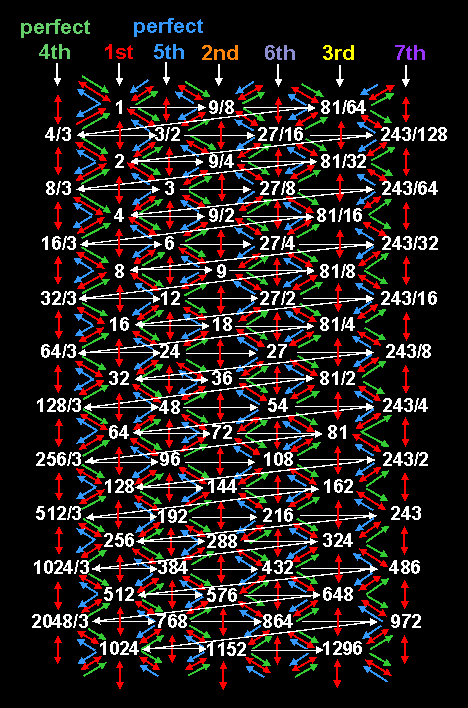
Red arrows link central tone ratio as the geometric mean of adjacent tone
ratios on either side of it.
Green arrows link central tone ratio as the harmonic
mean of adjacent tone ratios on either side of it.
Blue arrows link central tone
ratio as the arithmetic mean of adjacent tone ratios on either side of it.
Notice that the sequence of notes of ever increasing tone ratios oscillates in a zigzag fashion, the first pair of horizontal white arrows indicating the interval sequence:
1-T-T2,
where the tone interval T = 9/8, the first downward-pointing, white arrow indicating the interval of the leimma L = 256/243, the second set of horizontal white arrows indicating the same interval sequence relative to the major 3rd with tone ratio T2 and the second downward-pointing, white arrow indicating the second interval L in the complete set of seven intervals that generate each octave of the Pythagorean scale:
T-T-L-T-T-T-L.
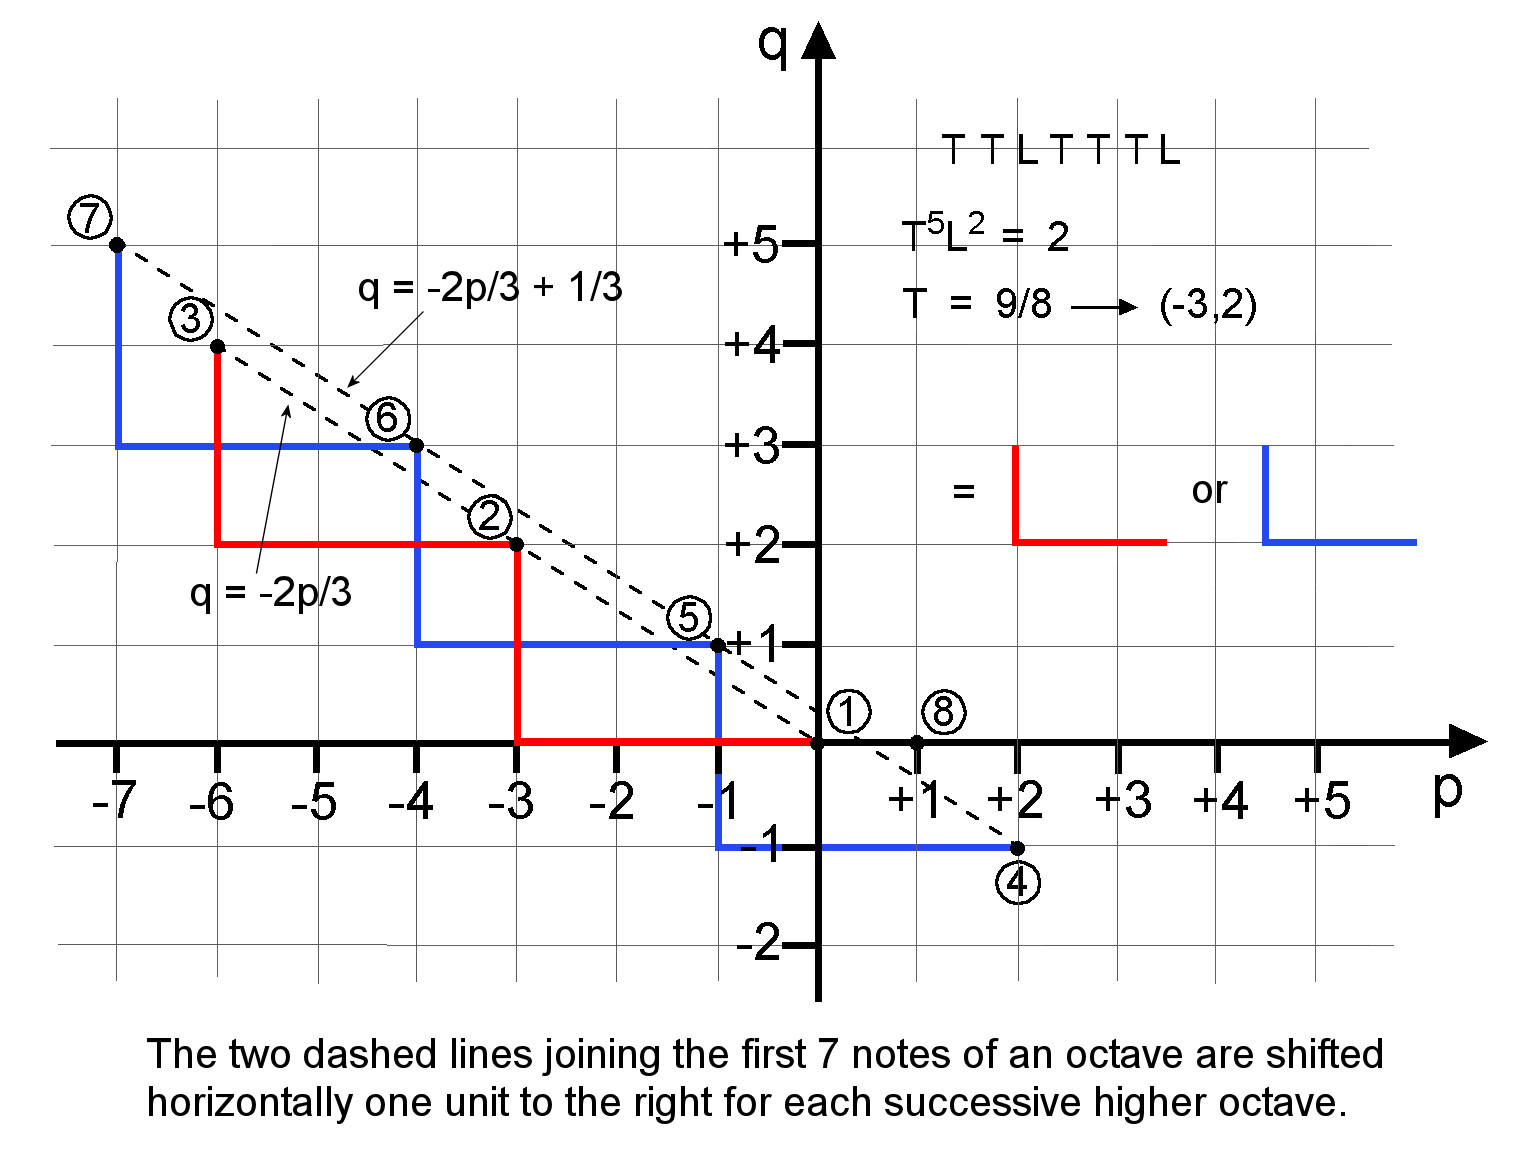
The same zigzag pattern manifests when we express each tone ratio as 2p3q and plot in a graph of p versus q the values of p and q that correspond to each note.

As T = 9/8 = 2-332, it is represented by a right angle whose horizontal side is three units long and whose vertical side is two units high. The first seven notes (numbered 1-7) are located at the ends of five right angles. The first three notes in the two red right angles lie on the straight line q = -2p/3; the next four notes in the three blue right angles lie on the parallel straight line q = -2p/3 + 1/3.. The octave (note 8) is at the point p = 1, q = 0. The second octave of notes below the third octave are located at corresponding points on a similar pair of lines shifted by one unit along the p axis. For the sake of clarity, this is not shown in the diagram above. A similar shift generates each successive octave. These repeated pairs of lines are the counterpart of the pairs of horizontal lines linking the tone ratios of notes in successive octaves of the Pythagorean musical scale, as shown in the first diagram.
| << Previous 1... 11 12 [13] 14 15 ...45 Next >> |